Investment Support
Aviation General Industrial Park
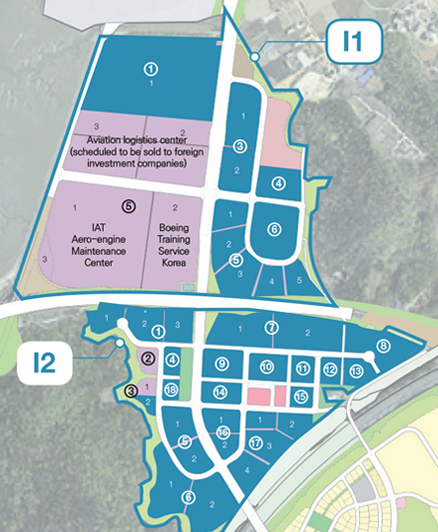
Aviation infrastructure was strategically built taking advantage of its geographical proximity to Incheon International Airport, with the operation of the IAT aircraft engine maintenance center and Boeing Korean Air flight training center. Aviation Logistics Center sold to foreign investment companies.
Phase I-1 Status
- Refer to the following uses according to Table 1 of the Building Act Enforcement Decree among buildings that can be built in the semi-industrial area:
-
- Dormitories in condominiums
- Class 1 neighborhood living facilities (incidental use only)
- Shops(limited to facilities that sell products produced in factories located in the relevant heavy industrial area)
- Home delivery facilities among transportation facilities
- Research institutes among educational and research facilities, educational centers (limited to facilities related to air operations)
-
- Facilities for seniors(except for welfare homes for the elderly subject to business plan approval under the Housing Act)
- Business facilities (excluding officetels), factories, warehouse facilities
- Dangerous goods storage and treatment facilities (except for gas stations, petroleum sales stations, liquefied petroleum gas filling stations, and sales stations)
- Automobile-related facilities
| Building to land ratio(%) | floor area ratio(%) | highest floor count |
|---|---|---|
| 70% or less | 350% or less | 5 floors or less |
Designated Industrial Complex Area
- Lotting out area : 323,827.3㎡
| Target industry | blueprint | blueprint no. | area(㎡) | ratio(%) | |
|---|---|---|---|---|---|
| Aviation-related manufacturing | Electronic components, computer, video, communication equipment manufacturing (C26) | I2 | I2-①-1 | 4,883 | |
| I2-①-2 | 6,873 | ||||
| I2-①-3 | 7,169 | ||||
| I2-③-2 | 2,529.5 | ||||
| I2-④ | 3,184.3 | ||||
| I2-⑦-1 | 11,899 | ||||
| I2-⑦-2 | 15,909 | ||||
| I2-⑧ | 12,486 | ||||
| I2-⑨ | 7,860 | ||||
| I2-⑩ | 6,994 | ||||
| I2-⑪ | 4,194 | ||||
| I2-⑫ | 3,704 | ||||
| I2-⑬ | 4,684 | ||||
| I2-⑭ | 5,749 | ||||
| I2-⑮ | 3,294 | ||||
| I2-⑰-1 | 4,237 | ||||
| I2-⑰-2 | 5,561 | ||||
| I2-⑰-3 | 7,450 | ||||
| I2-⑰-4 | 5,278 | ||||
| I2-⑱ | 2,326.5 | ||||
| Subtotal | 126,264,3 | 39 | |||
| Other machinery and equipment manufacturing industry (C29) | I1 | I1-①-1 | 63,082 | 19.5 | |
| Air transportation service industry | Land and pipeline transportation (H49) Water transportation (H49) Air Transportation(H51) |
L1 | I1-⑤-1 | 6,691 | |
| I1-⑤-2 | 6,983 | ||||
| I1-⑤-3 | 8,439 | ||||
| I1-⑤-4 | 5,547 | ||||
| I1-⑤-5 | 7,123 | ||||
| I1-⑥ | 15,909 | ||||
| I2 | I2-⑤-1 | 6,859 | |||
| I2-⑤-2 | 6,790 | ||||
| I2-⑥-1 | 12,795 | ||||
| I2-⑥-2 | 15,388 | ||||
| Subtotal | 92,443 | 28.5 | |||
| Warehousing and transportation-related services (H52) | I1 | I1-③-1 | 13,214 | ||
| I1-③-2 | 10,044 | ||||
| I1-④ | 9,175 | ||||
| I2 | I2-⑯-1 | 5,201 | |||
| I2-⑯-2 | 4,404 | ||||
| Subtotal | 42,038 | 13 | |||
Outside the Industrial Complex
- area : 169,379.7㎡
| Target industry | blueprint | blueprint no. | area(㎡) | ratio(%) |
|---|---|---|---|---|
| Aviation Logistics Center | I1 | I1-①-2 | 31,249.6 | |
| I1-①-3 | 30,966.1 | |||
| Aviation Engine Maintenance Center | I1 | I1-②-1 | 65,922.5 | |
| I1-②-3 | 3,282.9 | |||
| Air Operations Training Center | I1 | I1-②-2 | 32,614.5 | |
| Replotting | I2 | I2-② | 3,515.7 | |
| I2-③-1 | 1,828.4 |
Type of tenant industry, purpose planning equipment, etc. to be confirmed according to the 2022 implementation plan